Data
641,619 items of data are available, covering 499,741 participants.
Some values have special meanings defined by Data-Coding
100291.
Defined-instances run from 0 to 3, labelled using Instancing
2.
Units of measurement are people.
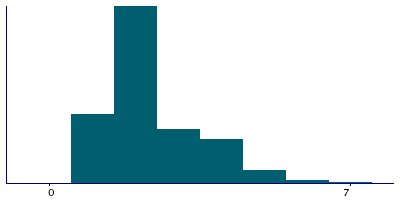
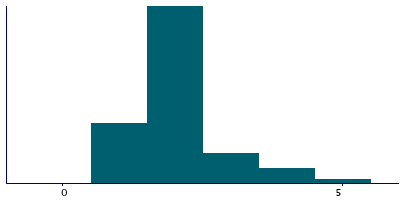
| Maximum | 100 |
| Decile 9 | 4 |
| Decile 8 | 3 |
| Decile 7 | 3 |
| Decile 6 | 2 |
| Median | 2 |
| Decile 4 | 2 |
| Decile 3 | 2 |
| Decile 2 | 2 |
| Decile 1 | 1 |
| Minimum | 1 |
|
|
- There are 56 distinct values.
- Mean = 2.35637
- Std.dev = 1.26943
- 1085 items above graph maximum of 7
- 2257 items have value -3 (Prefer not to answer)
- 180 items have value -1 (Do not know)
|
4 Instances
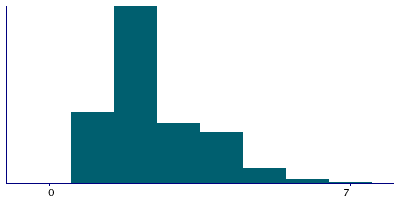
Instance 0 : Initial assessment visit (2006-2010) at which participants were recruited and consent given
499,678 participants, 499,678 items
| Maximum | 100 |
| Decile 9 | 4 |
| Decile 8 | 3 |
| Decile 7 | 3 |
| Decile 6 | 2 |
| Median | 2 |
| Decile 4 | 2 |
| Decile 3 | 2 |
| Decile 2 | 2 |
| Decile 1 | 1 |
| Minimum | 1 |
|
|
- There are 54 distinct values.
- Mean = 2.43377
- Std.dev = 1.32524
- 972 items above graph maximum of 7
- 2110 items have value -3 (Prefer not to answer)
- 170 items have value -1 (Do not know)
|
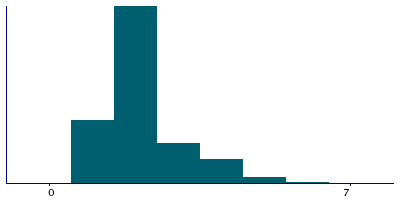
Instance 1 : First repeat assessment visit (2012-13)
20,289 participants, 20,289 items
| Maximum | 51 |
| Decile 9 | 4 |
| Decile 8 | 3 |
| Decile 7 | 2 |
| Decile 6 | 2 |
| Median | 2 |
| Decile 4 | 2 |
| Decile 3 | 2 |
| Decile 2 | 1 |
| Decile 1 | 1 |
| Minimum | 1 |
|
|
- There are 15 distinct values.
- Mean = 2.17822
- Std.dev = 1.09778
- 24 items above graph maximum of 7
- 21 items have value -3 (Prefer not to answer)
- 1 items have value -1 (Do not know)
|
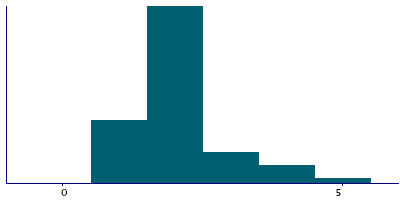
Instance 2 : Imaging visit (2014+)
100,761 participants, 100,761 items
| Maximum | 54 |
| Decile 9 | 3 |
| Decile 8 | 2 |
| Decile 7 | 2 |
| Decile 6 | 2 |
| Median | 2 |
| Decile 4 | 2 |
| Decile 3 | 2 |
| Decile 2 | 1 |
| Decile 1 | 1 |
| Minimum | 1 |
|
|
- There are 29 distinct values.
- Mean = 2.08636
- Std.dev = 0.998202
- 593 items above graph maximum of 5
- 113 items have value -3 (Prefer not to answer)
- 8 items have value -1 (Do not know)
|
Instance 3 : First repeat imaging visit (2019+)
20,891 participants, 20,891 items
| Maximum | 49 |
| Decile 9 | 3 |
| Decile 8 | 2 |
| Decile 7 | 2 |
| Decile 6 | 2 |
| Median | 2 |
| Decile 4 | 2 |
| Decile 3 | 2 |
| Decile 2 | 1 |
| Decile 1 | 1 |
| Minimum | 1 |
|
|
- There are 12 distinct values.
- Mean = 1.98707
- Std.dev = 0.927059
- 63 items above graph maximum of 5
- 13 items have value -3 (Prefer not to answer)
- 1 items have value -1 (Do not know)
|
Notes
ACE touchscreen question "Including yourself, how many people are living together in your household? (Include those who usually live in the house such as students living away from home during term, partners in the armed forces or professions such as pilots)"
The following checks were performed:
- If answer < 1 then rejected
- If answer > 100 then rejected
- If answer > 12 then participant asked to confirm
If the participant activated the Help button they were shown the message:
If you live alone, enter 1.
Include those who usually live in the house such as students living away
from home during term, partners in the armed forces or professions such as
pilots.
|
Field 709 was collected from all participants except those who indicated they were living in a sheltered accommodation or in a care home, as defined by their answers to Field 670
Coding 100291 defines 2 special values:
- -1 represents "Do not know"
- -3 represents "Prefer not to answer"
2 Related Data-Fields
| Field ID | Description | Relationship |
|---|
| 6141 | How are people in household related ... | Current Field affects who was asked to answer Field 6141 |
| 670 | Type of accommodation lived in | Current Field was collected from all participants except those who indicated they were living in a sheltered accommodation or in a care home, as defined by their answers to Field 670 |


