Data
538,604 items of data are available, covering 423,529 participants.
Some values have special meanings defined by Data-Coding
100291.
Defined-instances run from 0 to 3, labelled using Instancing
2.
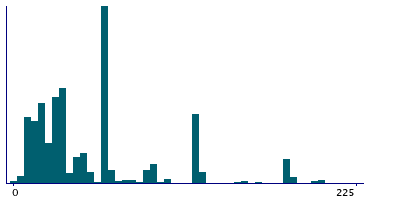
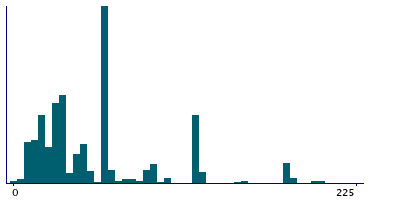
Units of measurement are minutes/day.
| Maximum | 1440 |
| Decile 9 | 120 |
| Decile 8 | 90 |
| Decile 7 | 60 |
| Decile 6 | 60 |
| Median | 40 |
| Decile 4 | 30 |
| Decile 3 | 30 |
| Decile 2 | 20 |
| Decile 1 | 15 |
| Minimum | 0 |
|
|
- There are 269 distinct values.
- Mean = 65.8268
- Std.dev = 74.3548
- 26939 items above graph maximum of 225
- 979 items have value -3 (Prefer not to answer)
- 49498 items have value -1 (Do not know)
|
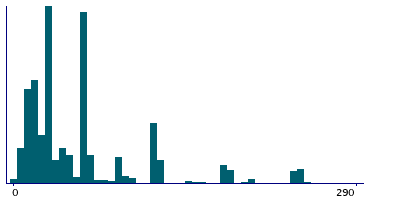
4 Instances
Instance 0 : Initial assessment visit (2006-2010) at which participants were recruited and consent given
410,579 participants, 410,579 items
| Maximum | 1440 |
| Decile 9 | 150 |
| Decile 8 | 90 |
| Decile 7 | 60 |
| Decile 6 | 60 |
| Median | 40 |
| Decile 4 | 30 |
| Decile 3 | 30 |
| Decile 2 | 20 |
| Decile 1 | 10 |
| Minimum | 0 |
|
|
- There are 253 distinct values.
- Mean = 66.288
- Std.dev = 77.2653
- 11330 items above graph maximum of 290
- 861 items have value -3 (Prefer not to answer)
- 41714 items have value -1 (Do not know)
|
Instance 1 : First repeat assessment visit (2012-13)
17,629 participants, 17,629 items
| Maximum | 1000 |
| Decile 9 | 120 |
| Decile 8 | 75 |
| Decile 7 | 60 |
| Decile 6 | 60 |
| Median | 30 |
| Decile 4 | 30 |
| Decile 3 | 25 |
| Decile 2 | 20 |
| Decile 1 | 10 |
| Minimum | 0 |
|
|
- There are 92 distinct values.
- Mean = 58.4087
- Std.dev = 62.5168
- 607 items above graph maximum of 230
- 12 items have value -3 (Prefer not to answer)
- 1115 items have value -1 (Do not know)
|
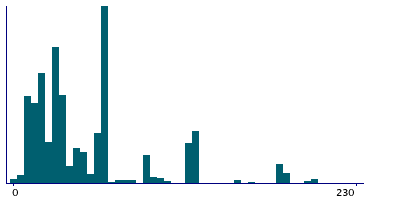
Instance 2 : Imaging visit (2014+)
91,350 participants, 91,350 items
| Maximum | 1200 |
| Decile 9 | 120 |
| Decile 8 | 90 |
| Decile 7 | 60 |
| Decile 6 | 60 |
| Median | 45 |
| Decile 4 | 30 |
| Decile 3 | 30 |
| Decile 2 | 20 |
| Decile 1 | 15 |
| Minimum | 0 |
|
|
- There are 160 distinct values.
- Mean = 65.3724
- Std.dev = 65.3553
- 3739 items above graph maximum of 225
- 89 items have value -3 (Prefer not to answer)
- 5592 items have value -1 (Do not know)
|
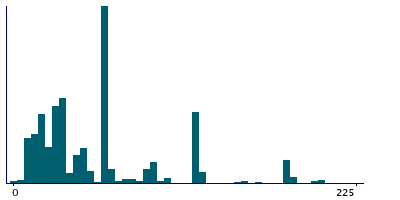
Instance 3 : First repeat imaging visit (2019+)
19,046 participants, 19,046 items
| Maximum | 960 |
| Decile 9 | 120 |
| Decile 8 | 90 |
| Decile 7 | 60 |
| Decile 6 | 60 |
| Median | 50 |
| Decile 4 | 30 |
| Decile 3 | 30 |
| Decile 2 | 20 |
| Decile 1 | 15 |
| Minimum | 0 |
|
|
- There are 97 distinct values.
- Mean = 65.3606
- Std.dev = 62.5761
- 743 items above graph maximum of 225
- 17 items have value -3 (Prefer not to answer)
- 1077 items have value -1 (Do not know)
|
Notes
ACE touchscreen question "How many minutes did you usually spend doing moderate activities on a typical DAY?"
The following checks were performed:
- If answer < 0 then rejected
- If answer > 1440 then rejected
- If answer < 10 then participant asked to confirm
- If answer > 300 then participant asked to confirm
If the participant activated the Help button they were shown the message:
If the time you usually spend doing moderate physical activity on each day
of the week varies a lot, give an average of the time you spend doing moderate
physical activity.
|
Field 894 was collected from participants who indicated that they did moderate physical activities for 10 minutes on at least 1 day per week in the previous 4 weeks, as defined by their answers to question Field 884
Coding 100291 defines 2 special values:
- -1 represents "Do not know"
- -3 represents "Prefer not to answer"
2 Related Data-Fields
| Field ID | Description | Relationship |
|---|
| 10962 | Duration of moderate physical activi ... | Field 10962 is the pilot-study predecessor of main-study Current Field |
| 884 | Number of days/week of moderate phys ... | Current Field was collected from participants who indicated that they did moderate physical activities for 10 minutes on at least 1 day per week in the previous 4 weeks, as defined by their answers to questi |
2 Applications
| Application ID | Title |
|---|
| 3173 | A multi-level approach to better understand the association between physical activity and sedentary behaviour, and cancer risk. |
| 4483 | Identification of modifiable and non-modifiable correlates of sedentary behaviours and physical activity in adults aged =65 years |


