Data
90,346 items of data are available, covering 54,054 participants.
Defined-instances run from 0 to 3, labelled using Instancing
2.
Array indices run from 0 to 1.
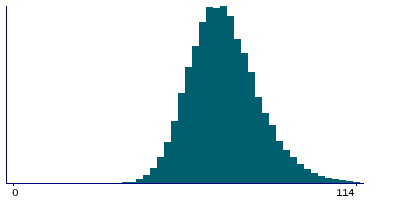
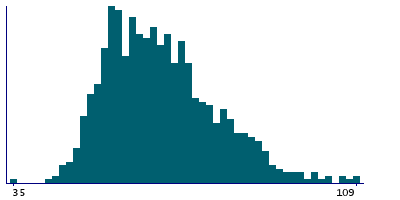
| Maximum | 160 |
| Decile 9 | 85 |
| Decile 8 | 79 |
| Decile 7 | 75 |
| Decile 6 | 72 |
| Median | 69 |
| Decile 4 | 66 |
| Decile 3 | 64 |
| Decile 2 | 60 |
| Decile 1 | 56 |
| Minimum | 22 |
|
|
- There are 112 distinct values.
- Mean = 70.0957
- Std.dev = 11.7176
- 141 items above graph maximum of 114
|
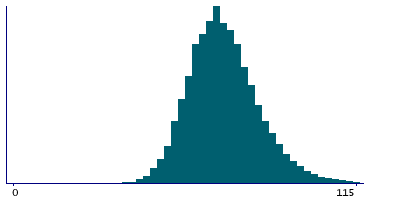
4 Instances
Instance 0 : Initial assessment visit (2006-2010) at which participants were recruited and consent given
43,760 participants, 72,431 items
| Maximum | 160 |
| Decile 9 | 86 |
| Decile 8 | 80 |
| Decile 7 | 76 |
| Decile 6 | 72 |
| Median | 70 |
| Decile 4 | 67 |
| Decile 3 | 64 |
| Decile 2 | 61 |
| Decile 1 | 57 |
| Minimum | 22 |
|
|
- There are 111 distinct values.
- Mean = 70.49
- Std.dev = 11.6654
- 100 items above graph maximum of 115
|
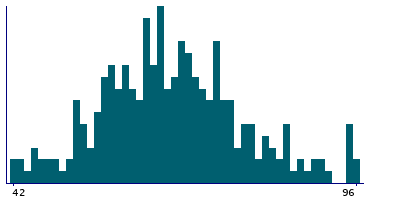
Instance 1 : First repeat assessment visit (2012-13)
219 participants, 262 items
| Maximum | 96 |
| Decile 9 | 82 |
| Decile 8 | 75.5 |
| Decile 7 | 72 |
| Decile 6 | 69 |
| Median | 66 |
| Decile 4 | 63.5 |
| Decile 3 | 60.5 |
| Decile 2 | 57.5 |
| Decile 1 | 53 |
| Minimum | 42 |
|
|
- There are 49 distinct values.
- Mean = 66.9656
- Std.dev = 11.1828
|
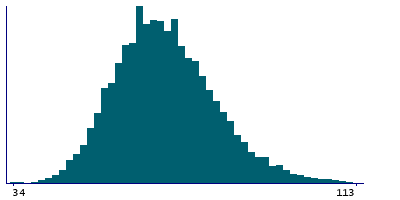
Instance 2 : Imaging visit (2014+)
10,023 participants, 15,838 items
| Maximum | 140 |
| Decile 9 | 84 |
| Decile 8 | 78 |
| Decile 7 | 74 |
| Decile 6 | 71 |
| Median | 68 |
| Decile 4 | 65 |
| Decile 3 | 62 |
| Decile 2 | 59 |
| Decile 1 | 55 |
| Minimum | 34 |
|
|
- There are 95 distinct values.
- Mean = 68.7531
- Std.dev = 11.7926
- 31 items above graph maximum of 113
|
Instance 3 : First repeat imaging visit (2019+)
1,224 participants, 1,815 items
| Maximum | 124 |
| Decile 9 | 82 |
| Decile 8 | 75 |
| Decile 7 | 71 |
| Decile 6 | 68 |
| Median | 65 |
| Decile 4 | 63 |
| Decile 3 | 60 |
| Decile 2 | 57 |
| Decile 1 | 53 |
| Minimum | 34 |
|
|
- There are 74 distinct values.
- Mean = 66.5295
- Std.dev = 11.6771
- 2 items above graph maximum of 111
|


