Data
337,293 items of data are available, covering 265,740 participants.
Some values have special meanings defined by Data-Coding
100569.
Defined-instances run from 0 to 3, labelled using Instancing
2.
Units of measurement are years.
| Maximum | 63 |
| Decile 9 | 15 |
| Decile 8 | 7 |
| Decile 7 | 4 |
| Decile 6 | 3 |
| Median | 3 |
| Decile 4 | 2 |
| Decile 3 | 2 |
| Decile 2 | 2 |
| Decile 1 | 1 |
| Minimum | 0 |
|
|
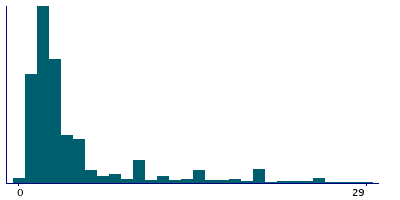
- There are 62 distinct values.
- Mean = 5.33451
- Std.dev = 6.58854
- 4460 items above graph maximum of 29
- 33512 items have value -10 (Less than a year ago)
- 404 items have value -3 (Prefer not to answer)
- 42156 items have value -1 (Do not know)
|
4 Instances
Instance 0 : Initial assessment visit (2006-2010) at which participants were recruited and consent given
265,442 participants, 265,442 items
| Maximum | 56 |
| Decile 9 | 12 |
| Decile 8 | 5 |
| Decile 7 | 4 |
| Decile 6 | 3 |
| Median | 3 |
| Decile 4 | 2 |
| Decile 3 | 2 |
| Decile 2 | 2 |
| Decile 1 | 1 |
| Minimum | 0 |
|
|
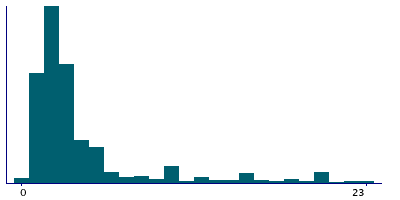
- There are 51 distinct values.
- Mean = 4.69136
- Std.dev = 5.83551
- 5154 items above graph maximum of 23
- 29593 items have value -10 (Less than a year ago)
- 310 items have value -3 (Prefer not to answer)
- 27345 items have value -1 (Do not know)
|
Instance 1 : First repeat assessment visit (2012-13)
10,145 participants, 10,145 items
| Maximum | 44 |
| Decile 9 | 16 |
| Decile 8 | 9 |
| Decile 7 | 5 |
| Decile 6 | 4 |
| Median | 3 |
| Decile 4 | 3 |
| Decile 3 | 2 |
| Decile 2 | 2 |
| Decile 1 | 1 |
| Minimum | 0 |
|
|
- There are 42 distinct values.
- Mean = 5.99182
- Std.dev = 6.90872
- 60 items above graph maximum of 31
- 784 items have value -10 (Less than a year ago)
- 8 items have value -3 (Prefer not to answer)
- 1531 items have value -1 (Do not know)
|
Instance 2 : Imaging visit (2014+)
51,322 participants, 51,322 items
| Maximum | 63 |
| Decile 9 | 20 |
| Decile 8 | 12 |
| Decile 7 | 10 |
| Decile 6 | 5 |
| Median | 5 |
| Decile 4 | 3 |
| Decile 3 | 3 |
| Decile 2 | 2 |
| Decile 1 | 2 |
| Minimum | 0 |
|
|
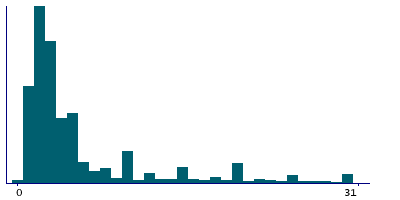
- There are 61 distinct values.
- Mean = 8.00886
- Std.dev = 8.54992
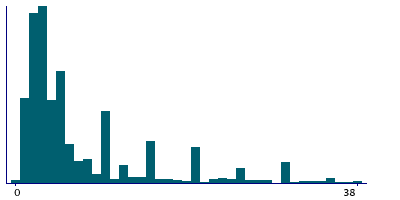
- 446 items above graph maximum of 38
- 2683 items have value -10 (Less than a year ago)
- 74 items have value -3 (Prefer not to answer)
- 10757 items have value -1 (Do not know)
|
Instance 3 : First repeat imaging visit (2019+)
10,384 participants, 10,384 items
| Maximum | 63 |
| Decile 9 | 24 |
| Decile 8 | 15 |
| Decile 7 | 10 |
| Decile 6 | 7 |
| Median | 5 |
| Decile 4 | 4 |
| Decile 3 | 3 |
| Decile 2 | 2 |
| Decile 1 | 2 |
| Minimum | 0 |
|
|
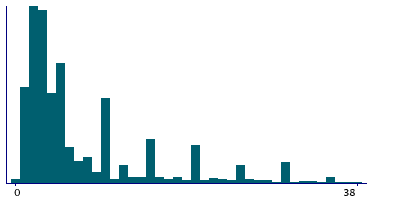
- There are 54 distinct values.
- Mean = 9.07219
- Std.dev = 9.3684
- 23 items above graph maximum of 46
- 452 items have value -10 (Less than a year ago)
- 12 items have value -3 (Prefer not to answer)
- 2523 items have value -1 (Do not know)
|
Notes
ACE touchscreen question "How many years ago was your last cervical smear test?"
The following checks were performed:
- If answer < 0 then rejected
- If answer > Participants age - 10 years then rejected
- If answer > 15 then participant asked to confirm
If the participant activated the Help button they were shown the message:
If you are unsure, please provide an estimate or select Do not know.
|
Field 2704 was collected from women who indicated that they had had a cervical smear test, as defined by their answers to Field 2694
Coding 100569 defines 3 special values:
- -10 represents "Less than a year ago"
- -1 represents "Do not know"
- -3 represents "Prefer not to answer"
1 Related Data-Field
| Field ID | Description | Relationship |
|---|
| 2694 | Ever had cervical smear test | Current Field was collected from women who indicated that they had had a cervical smear test, as defined by their answers to Field 2694 |
4 Applications
| Application ID | Title |
|---|
| 26629 | Cross-cultural variations in female reproductive health and non-communicable diseases: analysis of 500,000 participants from the UKBiobank and the InterLACE consortium |
| 5791 | Development and validation of risk prediction model for breast and ovarian cancers |
| 17435 | Exploring the genetics of irritable bowel syndrome: the ?bellygenes? initiative (project approved by bbmri-lpc) |
| 871 | Genetic factors associated with being at different extremes of the reproductive lifespan |


