Data
638,106 items of data are available, covering 498,931 participants.
Defined-instances run from 0 to 3, labelled using Instancing
2.
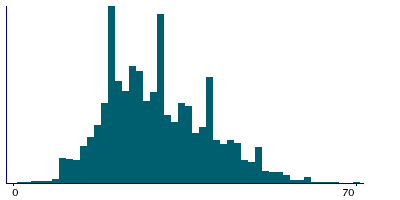
Units of measurement are Kg.
| Maximum | 90 |
| Decile 9 | 46 |
| Decile 8 | 41 |
| Decile 7 | 36 |
| Decile 6 | 32 |
| Median | 30 |
| Decile 4 | 27 |
| Decile 3 | 24 |
| Decile 2 | 22 |
| Decile 1 | 18 |
| Minimum | 0 |
|
|
- There are 89 distinct values.
- Mean = 31.1808
- Std.dev = 11.1824
- 130 items above graph maximum of 74
|
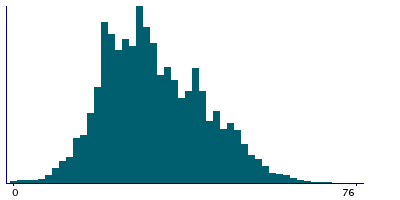
4 Instances
Instance 0 : Initial assessment visit (2006-2010) at which participants were recruited and consent given
498,594 participants, 498,594 items
| Maximum | 90 |
| Decile 9 | 48 |
| Decile 8 | 42 |
| Decile 7 | 38 |
| Decile 6 | 34 |
| Median | 30 |
| Decile 4 | 28 |
| Decile 3 | 24 |
| Decile 2 | 22 |
| Decile 1 | 18 |
| Minimum | 0 |
|
|
- There are 88 distinct values.
- Mean = 31.6787
- Std.dev = 11.2826
- 33 items above graph maximum of 78
|
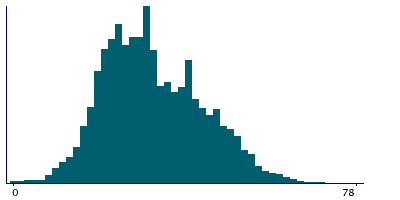
Instance 1 : First repeat assessment visit (2012-13)
20,192 participants, 20,192 items
| Maximum | 82 |
| Decile 9 | 42 |
| Decile 8 | 36 |
| Decile 7 | 32 |
| Decile 6 | 29 |
| Median | 26 |
| Decile 4 | 22 |
| Decile 3 | 20 |
| Decile 2 | 18 |
| Decile 1 | 14 |
| Minimum | 0 |
|
|
- There are 70 distinct values.
- Mean = 26.8562
- Std.dev = 10.5901
- 4 items above graph maximum of 70
|
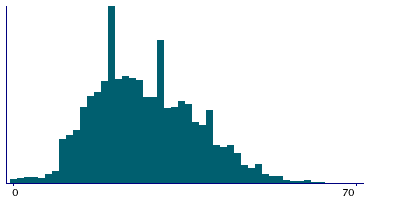
Instance 2 : Imaging visit (2014+)
99,041 participants, 99,041 items
| Maximum | 90 |
| Decile 9 | 44 |
| Decile 8 | 40 |
| Decile 7 | 35 |
| Decile 6 | 32 |
| Median | 28 |
| Decile 4 | 26 |
| Decile 3 | 24 |
| Decile 2 | 20 |
| Decile 1 | 18 |
| Minimum | 0 |
|
|
- There are 82 distinct values.
- Mean = 29.8393
- Std.dev = 10.5999
- 58 items above graph maximum of 70
|
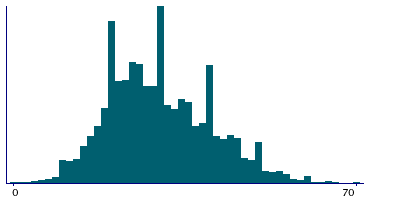
Instance 3 : First repeat imaging visit (2019+)
20,279 participants, 20,279 items
| Maximum | 80 |
| Decile 9 | 44 |
| Decile 8 | 39 |
| Decile 7 | 35 |
| Decile 6 | 31 |
| Median | 28 |
| Decile 4 | 26 |
| Decile 3 | 23 |
| Decile 2 | 20 |
| Decile 1 | 18 |
| Minimum | 0 |
|
|
- There are 73 distinct values.
- Mean = 29.797
- Std.dev = 10.4443
- 4 items above graph maximum of 70
|
Notes
Right grip strength.
An issue has been identified with the a small amount of grip strength data (
Field 46 and
Field 47) collected in Cheadle during the first repeat visit in 2013 (Instance 1). We are working on modelling a correction factor for this data. In the meantime, researchers are advised to treat the 2013 grip strength data with caution.
In particular, readings from dynamometer 7336 are lower than expected. The mean error is approximately 2 kg for readings taken in January 2013, gradually increasing to a mean error of 14 kg for readings taken in June 2013.
The dynamometer was recalibrated after June 2013, during scheduled yearly external calibration, and there is no evidence of problems with dynamometer 7336 during instances 0, 2 or 3.
2 Related Data-Fields
| Field ID | Description | Relationship |
|---|
| 46 | Hand grip strength (left) | Field 46 is the opposite-side complement to Current Field |
| 20043 | Reason for skipping grip strength (r ... | Field 20043 gives reasons for skipping measurement Current Field |
7 Applications
| Application ID | Title |
|---|
| 23482 | Association of genetics, biomarkers, and environment with cognitive function and mental health |
| 12885 | Genetic determinants of objective physical activity levels and fitness in the UK Biobank |
| 20915 | Genome-wide integrative and network-based approaches to obstructive lung diseases and their comorbidities |
| 32568 | Phenomewide Heritability Analysis |
| 40103 | Quantifying abnormalities of haematopoietic and immune system in patients with Bardet-Biedl syndrome. |
| 8447 | The genetic architecture and prediction of anthropomorphic measurements |
| 20684 | Understanding the associations between environmental exposures, health behaviours and health outcomes |


