Data
640,466 items of data are available, covering 499,541 participants.
Defined-instances run from 0 to 3, labelled using Instancing
2.
Units of measurement are cm.
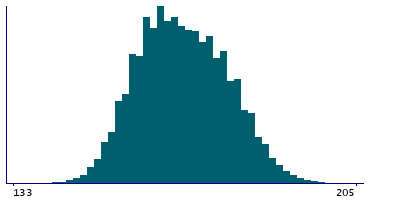
| Maximum | 209 |
| Decile 9 | 181 |
| Decile 8 | 177 |
| Decile 7 | 174 |
| Decile 6 | 171 |
| Median | 168 |
| Decile 4 | 165 |
| Decile 3 | 163 |
| Decile 2 | 160 |
| Decile 1 | 157 |
| Minimum | 75 |
|
|
- Mean = 168.515
- Std.dev = 9.28198
- 27 items below graph minimum of 133
- 2 items above graph maximum of 205
|
4 Instances
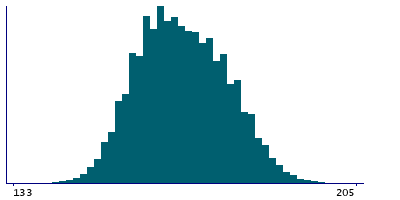
Instance 0 : Initial assessment visit (2006-2010) at which participants were recruited and consent given
499,399 participants, 499,399 items
| Maximum | 209 |
| Decile 9 | 181 |
| Decile 8 | 177 |
| Decile 7 | 174 |
| Decile 6 | 171 |
| Median | 168 |
| Decile 4 | 165 |
| Decile 3 | 163 |
| Decile 2 | 160 |
| Decile 1 | 157 |
| Minimum | 75 |
|
|
- Mean = 168.444
- Std.dev = 9.27941
- 27 items below graph minimum of 133
- 2 items above graph maximum of 205
|
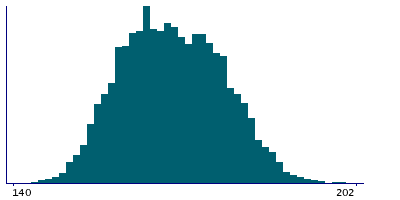
Instance 1 : First repeat assessment visit (2012-13)
20,291 participants, 20,291 items
| Maximum | 202 |
| Decile 9 | 181 |
| Decile 8 | 177 |
| Decile 7 | 174 |
| Decile 6 | 171 |
| Median | 168 |
| Decile 4 | 166 |
| Decile 3 | 163 |
| Decile 2 | 160 |
| Decile 1 | 157 |
| Minimum | 140 |
|
|
- Mean = 168.698
- Std.dev = 9.14179
|
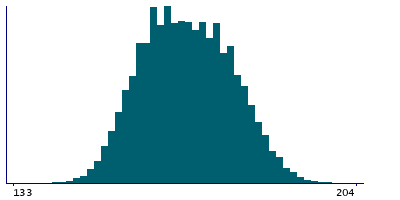
Instance 2 : Imaging visit (2014+)
99,951 participants, 99,951 items
| Maximum | 204 |
| Decile 9 | 181 |
| Decile 8 | 177 |
| Decile 7 | 174 |
| Decile 6 | 171 |
| Median | 168.5 |
| Decile 4 | 166 |
| Decile 3 | 163 |
| Decile 2 | 160.1 |
| Decile 1 | 157 |
| Minimum | 133 |
|
|
- Mean = 168.829
- Std.dev = 9.30204
|
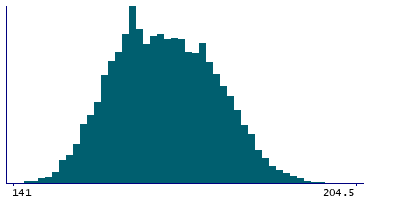
Instance 3 : First repeat imaging visit (2019+)
20,825 participants, 20,825 items
| Maximum | 204.5 |
| Decile 9 | 181 |
| Decile 8 | 177 |
| Decile 7 | 174 |
| Decile 6 | 171 |
| Median | 168 |
| Decile 4 | 165.5 |
| Decile 3 | 163 |
| Decile 2 | 160 |
| Decile 1 | 156.5 |
| Minimum | 139.8 |
|
|
- Mean = 168.53
- Std.dev = 9.34882
|


